The Pages tab in Semrush's Advertising Research tool reveals which landing pages receive the most paid traffic from a competitor's Google Ads campaigns.

Use this tab to:
- Uncover top-performing competitor landing pages
- Identify which products or categories they promote most
- Analyze traffic distribution across URLs
- Explore page-level backlink profiles
To access the report:
- Open the Advertising Research tool from the Semrush sidebar.

- Enter your competitor’s domain in the main search bar.

- Click the Pages tab in the navigation menu.

Step 1: Adjust Your View
The settings at the top of the report tailor your view so you can best compare it to your own market and campaigns.
Database
Select the country where the ads you want to analyze are running.

Device
Switch between desktop and mobile to analyze how landing page traffic varies across platforms.

Date
Pick a specific time period or leave it set to the default month.

Currency
Adjust how CPC data is displayed (based on regional selection).
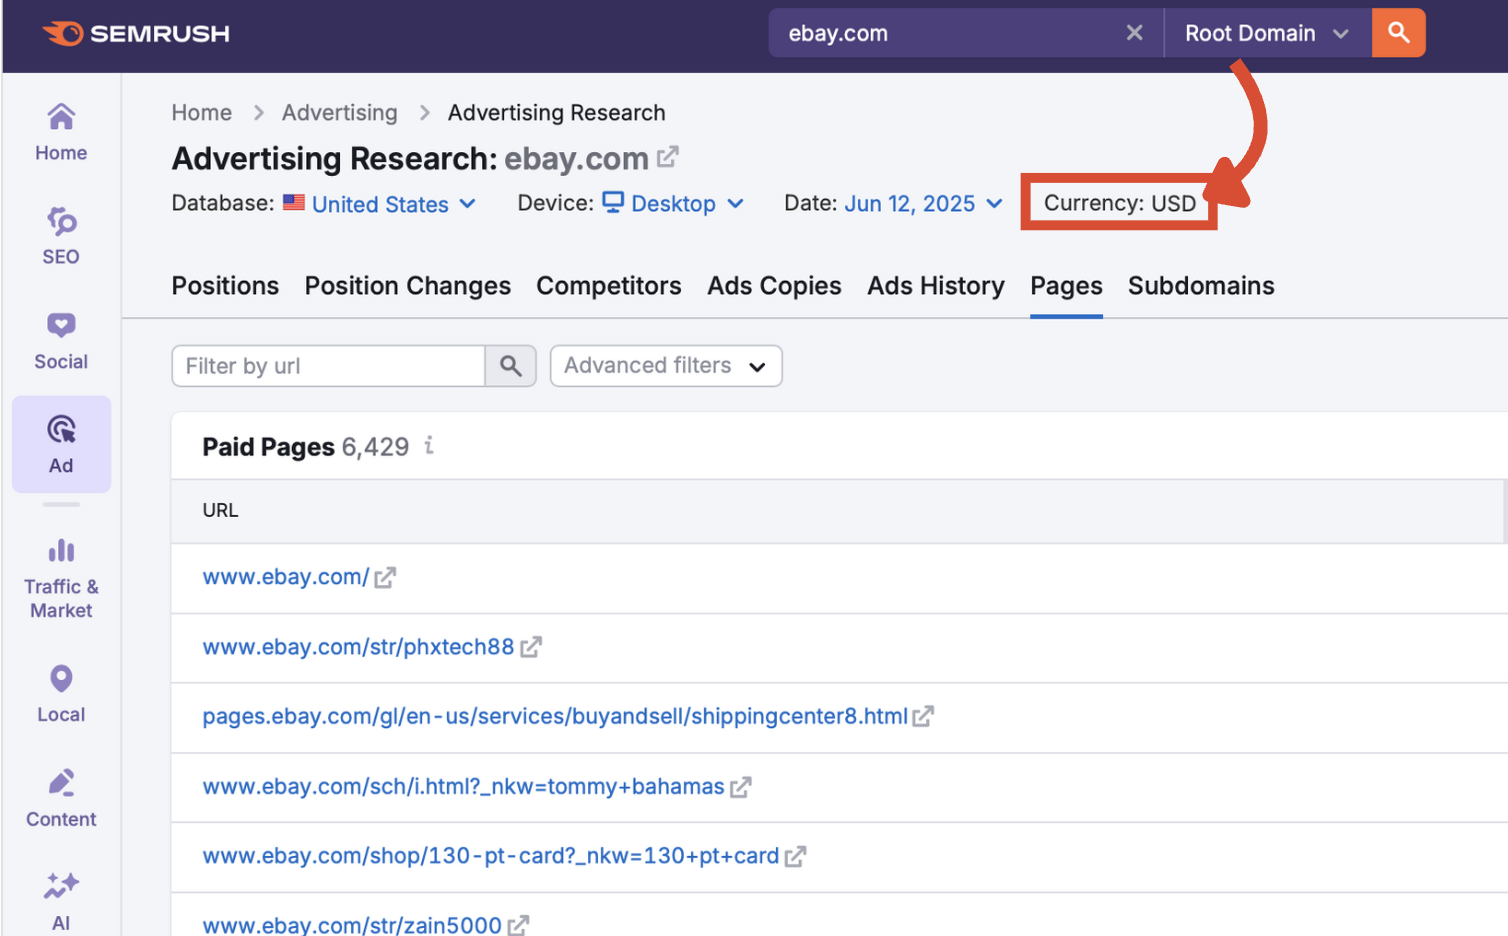
Filters
You can also use the search bar to filter by URL, narrowing it down to only the landing pages you want to see most.

Or open the Advanced filters drop-down to refine results by URL, traffic volume, and keyword count.

Step 2: Understand the Paid Pages Table
The Paid Pages table shows you where paid traffic is being directed. Each row represents a landing page from the analyzed domain. Sort by traffic, traffic %, or backlinks.
URL
The specific landing page receiving traffic. Click the blue URLs to see the Positions report for that page, or click the grey arrow to visit the page itself.

Traffic
Estimated number of monthly visits driven to this page by Google Ads. This helps identify the most popular pages in paid campaigns.

Traffic %
The percentage of the domain’s total paid traffic attributed to that landing page.

Keywords
Number of keywords that direct paid traffic to the page.
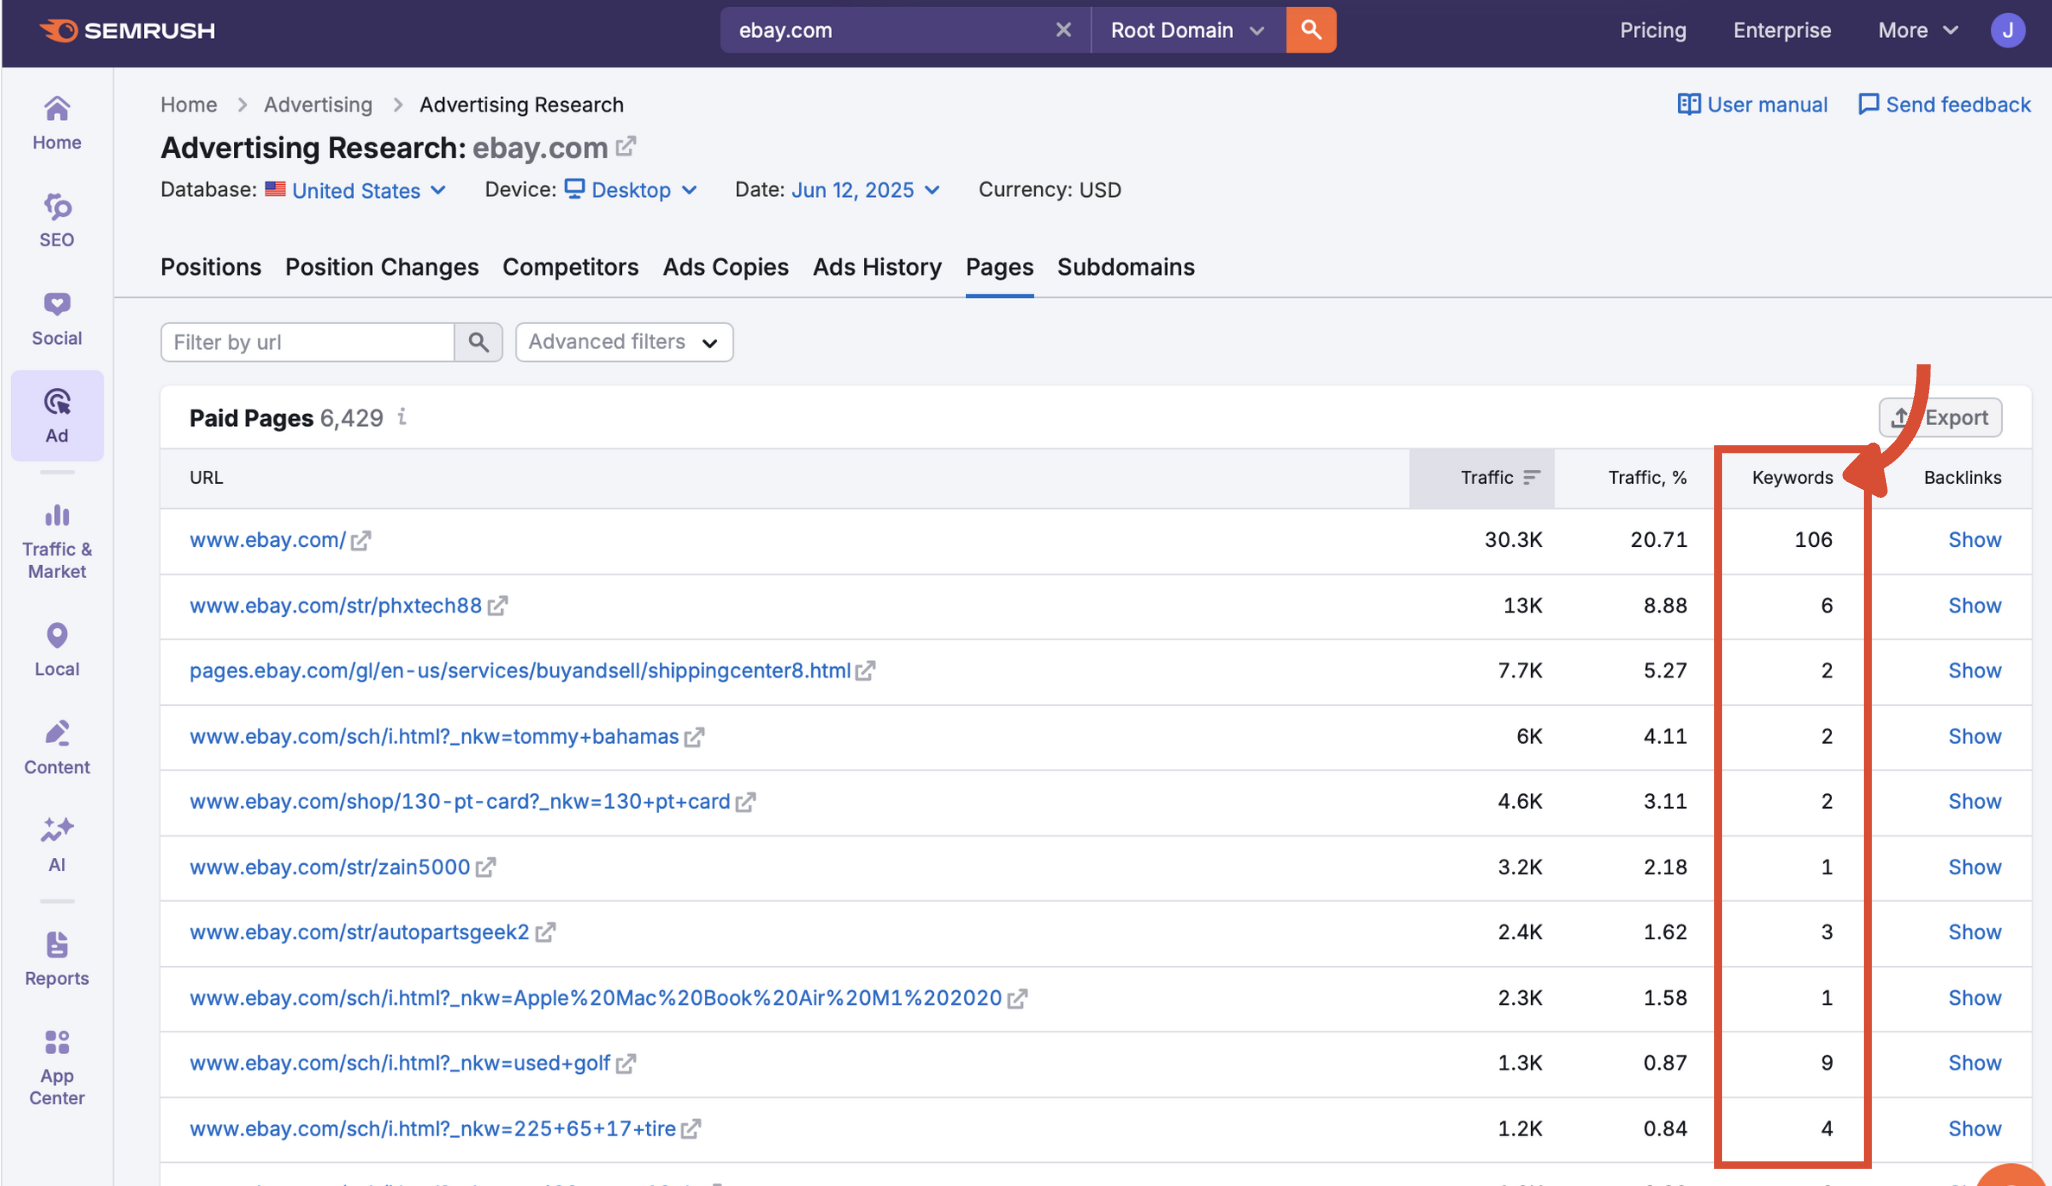
Backlinks
Click Show to reveal the number of referring domains linking to the page. This can help you evaluate page authority and organic visibility.

Export
Export the data to CSV, Excel, or PDF using the export button in the top-right corner. Choose to export all or some of the rows using the blue toggle.

What to Do Next
The Pages tab is a valuable tool to study which parts of a competitor’s site are powering their PPC success.
Next, move on to the Subdomains tab to understand how paid search traffic is distributed across different sections of your competitor’s website. Or explore:
- Positions: See which keywords trigger a domain’s ads
- Position Changes: Track keyword rank movement over time
- Competitors: Identify who else is bidding on similar terms
- Ads Copies: Analyze messaging and copy tactics
- Ads History: Review historic ad placements by keyword
Every tab in the Advertising Research toolkit includes a detailed manual like this one to help you get the most from your competitive analysis. Get a full view of your paid ad performance with the complete suite of tools in the Advertising Toolkit and start optimizing for better results.